
Hey team, Adam here. Welcome to our 2021 blog here at Whaling City Solar. This unique “Engineers View of the Big Picture” series of articles are a history of how my wife and I became convinced to put solar panels on our house and why I’ve chosen the world of solar energy for my profession. I genuinely believe you should take a look how a solar system pays for itself before writing it off as a too expensive or a trend, but I also want to show why. More so than our other articles, this series is written in my language – half Dad and I’s engineering background, and half Mom’s teaching background. Both of whom taught me to never stop sharing knowledge.
Chapter 3 – Why does electricity cost what it costs?
Here we are in Chapter 3, and good news – we’re going to start seeing some solar related content! If you haven’t been following along our article series, may I suggest starting at Chapter 1 and catching up first. So far we’ve covered what a kWh is, how they’re used, where they’re made and how they get to our home. We’ve also learned that the electric utility company controls the whole process, and then sets a rate to charge you in ¢/kWh.
What we are going to dive into today is where that price comes from, and how to evaluate if it’s a fair shake or not. To do that we’re going to have a bit more math than normal, but we’ll take our time and break it down. The goal is to grow your broad understanding of how we live hand in hand with our grid, not just be passive participants.
Powering the village
Let’s have a little fun and take a time machine to frame the basic macro-economic principles in play here:
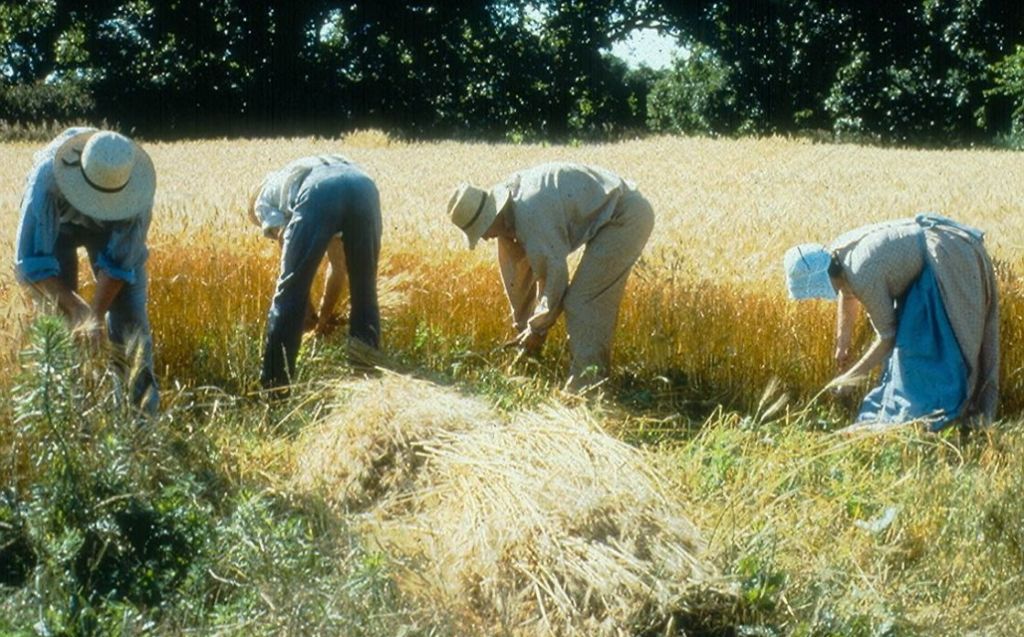
In a poof of smoke you materialize in an old wooden New England town council meeting room, right in the middle of a heated debate. Listening for a few minutes you piece together that the council is arguing over building a new grist mill like the township to the west. “Well what does does our fearless leader think?” – and you realize everyone’s looking right at you.

You murmur something about a recess and pull the record keeper into your chambers to…um…check their notes on the meeting thus far.
As you come to understand it right now everybody grows their own wheat, and mills it themselves to eat each day. It’s takes a long time and it’s thankless work, especially the milling part. There are concerns that it will take a lot of time and resources to build the mill, and many in town are ok with the current status quo. Then again, once the mill is built, it’s going to run a long time and drastically reduce the work to process the harvest each year for the village. Your head is swimming with a bunch of questions all muddled together:
- Looking at the river flowing by and where the forest is…man that’s gonna be a ton of work to build a mill.
- I’m gonna need someone to run it and maintain it, everyone’s already busy who wants extra work?
- Every villager is going to have to deliver their own grain to the mill, and some people live pretty far down the road
- If I build this it better be big enough to handle all our consumption even it breaks down a little while
- Should I look at this over the next 5 years? or 20? or 200!?

How will you start to make sense of this problem? You copy what modern governments do and charter a special committee of the most practical men and women on council and with some hard work you begin to put numbers to paper.
- Each household consumes a little under 2lb of grain per day – or 700lbs per year.
- It takes 30 minutes per day on average throughout the year to harvest the grain – and an average of 45 minutes if they had to deliver it to the mill in regular intervals.
- It takes them 45 minutes per pound (1.5 hours total) to mill the grain down to flour by hand in their own homes
- The mill will get sized to produce 20,000 lbs of grain a year – enough to feed all 100 households in the village even if idle 10% of the time
- It’ll take a member of each household diverting 5 hours each afternoon for 2 years year to cut the wood, make the gears, dam the river and construct the mill – adding up to whopping 365,000 hours. Hard sell.
- The mill will employ 2 workers for an additional 1000 hours a year to keep it maintained and spinning at full capacity
- The mill should work forever provided it has proper upkeep
Everyone agrees that these numbers properly capture the situation – but at the next council meeting everyone again turns to you to answer the big question “Should we build the mill or not?”
With your new numbers you start doing some math to show the village how you view the current “grow your own; mill your own” system:
Thankfully the math is almost impossibly simple. Right now it takes 1 hour per day per household to yield 1 pound of flour – 30 minutes to harvest and 90 minutes to mill 2 pounds. Next year you expect the same result with no signs of anything changing.
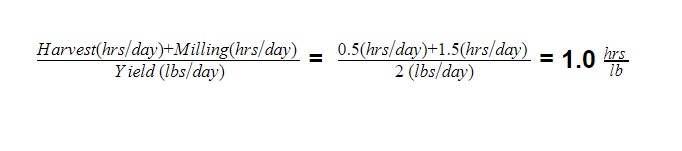
After the mill things will get more complicated to measure. You explain that to evaluate if the mill as whole is a good idea or not, you want to define its contribution over its lifetime. Since you don’t know the mills lifetime you start to count up the total amount of input into the mill and the total yield out of the mill over the next 5 years. You think people can get their head that time frame at least. You remember your 8th grade rules from Normandin Jr. High and write out the following relationship:
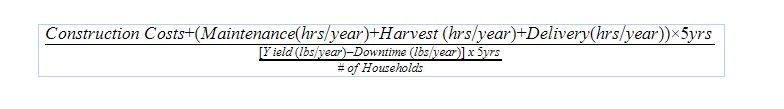
Everyone laughs. What did you just call that – an eekwaytion?? Algebra isn’t this villages strong point. You go back to the drawing board and come back with something a bit easier to understand.
You want to show that the mill will require work by individual households to deliver their harvest and a collective effort by the village as a whole to build and maintain the mill. You show how much work will go into the mill, accounted for both upfront costs and ongoing costs:
| Village Contribution | Rate | Village Total (hours) |
|---|---|---|
| Mill Construction | 365,000 – one time | 365,000 |
| Mill Operation | 1000/year | 1000/year |
| Harvest | 30 minutes/day x 100 households | 18250/year |
| Delivery | 15 minutes/day x 100 households | 9,125/year |
You then add to the chart to show what comes out of the mill. Each year the mill will produce enough to feed each household 2lbs per day each year – so 73,000lbs of grain/year. You also add a column to add up your 5 year period.
(Editors Note: Most grain mills could produce 1000lbs+ per day. Far too much time was spent researching historical grain production rates to simply illustrate a principle without the word solar anywhere….)
Mill Projection over 5 years:
| Village Contribution | Rate | Village Total (hours) | Years in Operation | Total input |
|---|---|---|---|---|
| Mill Construction | 365,000 – one time | 365,000 | n/a | 365,000 |
| Mill Operation | 1000 hrs/year | 1000/year | 5 | 5,000 |
| Harvest | 30 minutes/day x 100 households | 18250/year | 5 | 91,250 |
| Delivery | 15 minutes/day x 100 households | 9,125/year | 5 | 45,625 |
| SUM | 506,825 | |||
| Grain Production | 73,000lbs/year | 73,000lbs/year | 5 | 365,000 |
| Total Hours per Lb = | 1.38 | |||
| Vs. Current Hours per Lb = | 1.00 |
A dramatic pause fells the room. The look on everyone’s faces says it all. An cranky man calls from the back “Are you kidding me? All this to sell us on1.38 hrs/lb? That’s more work than it takes us to eat now doing it all by hand!”
With a smile you erase the 5 year mark in the years column and start showing your overall point:
Mill Projection over 20 years:
| Village Contribution | Rate | Village Total | Years in Operation | Total input |
|---|---|---|---|---|
| Mill Constructi0n | 365,000 hours – one time | 365,000 | n/a | 365,000 |
| Mill Operation | 1000 hrs/year | 1000/year | 20 | 20,000 |
| Harvest | 30 minutes/day x 100 households | 18250/year | 20 | 365,000 |
| Delivery | 15 minutes/day x 100 households | 9,125/year | 20 | 182,500 |
| SUM | 932,500 | |||
| Grain Production | 73,000lbs/year | 73,000lbs/year | 20 | 146,0000 |
| Total Hours per Lb = | 0.63 | |||
| Vs. Current Hours per Lb = | 1.00 |
Mill Projection over 50 years:
| Village Contribution | Rate | Village Total | Years in Operation | Total input |
|---|---|---|---|---|
| Mill Constructi0n | 365,000 hours – one time | 365,000 | n/a | 365,000 |
| Mill Operation | 1000 hrs/year | 1000/year | 50 | 50,000 |
| Harvest | 30 minutes/day x 100 households | 18250/year | 50 | 912,500 |
| Delivery | 15 minutes/day x 100 households | 9,125/year | 50 | 456,250 |
| SUM | 1,783,750 | |||
| Grain Production | 73,000lbs/year | 73,000lbs/year | 50 | 3,650,000 |
| Total Hours per Lb = | 0.48 | |||
| Vs. Current Hours per Lb = | 1.00 |
With theatrical flurry of gestures you could have only learned from My Cousin Vinny – you point out that expected work is complicatedly tied to how long they can make use of the initial investment. Life after the mill is practically easy street cutting their labor time in half. You urge them to consider investing in their future with sweat equity now. By the time their kids have grown into leadership positions, all the saved time can be allocated to future projects and they will surely become the top township on the bay.

Eyebrows start to raise. You hear low murmuring through the crowd. It’s starting to click! By calculating across different time scales of mill operation you’ve unwittingly invented what modern economists would call the Levelized Cost of Grain (LCOG). The council votes and the mill passes unanimously. As you start to hear conversations start about levelizing the cost of sewage, things start getting blurry and you awaken back at your home office desk where you have a Zoom call about to start. What a trip….could any of this apply to todays life??
The Levelized Cost of Energy – LCOE
Thanks for sticking through our grain analogy. In addition to having a little fun, I wanted to tap into your natural intuition about how to think about community shared resources. As I’m sure you’ve realized the same principles are at play with our modern food supply chain, our public transit systems and my favorite topic – the energy grid.
I also had a feeling that the below image isn’t the best to start off an article with:
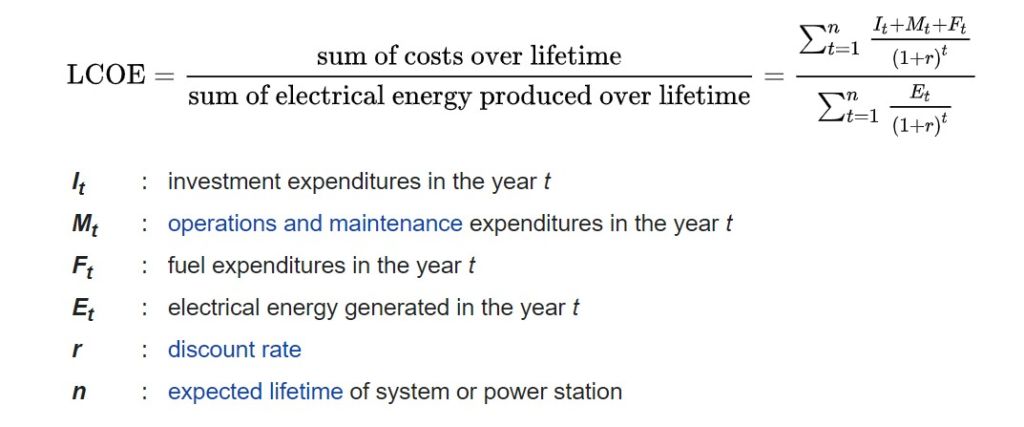
But this image/equation is the whole point. All power plant development, whether it be fossil fuel driven, nuclear or renewable does the same math over and over again to decide when, where, and what capacity to build their infrastructure. In the case of our recently lost local Brayton point Coal Plant in Somerset, MA with 1,600,000kW capacity – that power output was worth $365,000 an hour in end retail rate. The 250 employees it took to keep the plant running safely cost millions per year and the investment capital in todays dollars was in the $10+ billion range. Where is it now?

Energy like everything else is a business. Whatever the costs are to run the plant, the owners need to put an additional margin on those costs to make a profit. Each year the cost to mine, drill and frack for fossil fuels rises as we continue to properly regulate their industries because of the effects on our environment. The cost for the raw materials is rising. Each year our old grid infrastructure we discussed in Chapter 2 continues to deteriorate and require more maintenance on the substations and power lines. The cost for delivery is rising. The answer to that big fancy equation with the summation symbols now adds up to $0.22/kWh on your bill. It doesn’t sound like a lot – but neither did 1 hour per pound of grain without another number to compare it to. Starting to get a picture of what going on here?
Enter the Alternative – Personal Power Plants
We’ve learned a lot about energy so far. Let’s see if we have the tools to evaluate say… a new residential solar system. Let’s start with the variables in the LCOE equation we need to know:
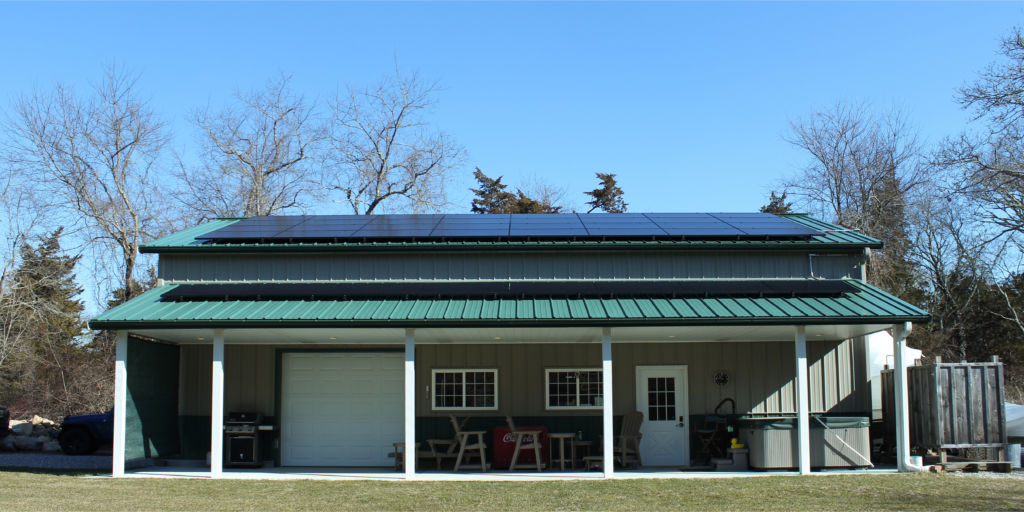
- Cost to construct – The total turnkey costs to install the solar system minus any government rebates
- Raw fuel costs – What you pay for the sunlight hitting your property each day = $0!
- Delivery costs – Transmit the power of ~100ft of wires going from your roof to your main service panel = $0.
- Maintenance costs – Upkeep the electrical system with no moving parts = you guessed it $0
- Production – Easily calculated by your local solar contractor, for whatever the system costs they’ll tell you what to expect in output.
| Solar Variable | Rate | Power | Years applicable | Total |
|---|---|---|---|---|
| Turnkey Constructi0n | $3.00/W | 8.0kW | n/a | $24,000 |
| Federal Tax Credit (ITC) | 26% of system cost | n/a | -$6,240 | |
| MA SMART Program | $0.08/kWh | 9,100kWh/year | 10 | -$7,280 |
| Delivery | $0 | 9,100kWh/year | 25 | $0 |
| Delivery | $0 | 9,100kWh/year | 25 | $0 |
| Maintenance | $0 | 9,100kWh/year | 25 | $0 |
| Self generated Electricity | 9,100kWh/year | 25 | 227,500 | |
| Total $/kWh = | $0.046 (!) | |||
| Vs. Current $/kWh | $0.223 |

Eyebrows raise. There’s a low murmuring through the crowd. It’s starting to click! Drawing an analogy back to our grain village, If we had looked at the cost of solar over the next 5 years only – the LCOE would come out to be right around $0.25/kWh vs. the $0.22/kWh from the utility. We’d be back to harvesting the grain by hand with this short sighted viewpoint. But since a solar system is warrantied, stress tested and field proven to operate for 25+ years the cost drops by 80% levelized over time.
Conclusion
I wanted to have a little fun today because I have very fond memories of my first AHA! Moment, when I first understood the math behind why so many corporations were pouring millions of dollars into solar each year. Unfortunately most of our country is not in the position to float the equity upfront to yield the benefits over time.
There’s a lot more complexity woven into the fabric of how household, the utilities, the government and the banks need to work together to make this technology more accessible. Making it a good thing we have 5 more articles to go in this series!
Finding our content interesting? We’re realizing there are more of you out there than we thought! So because someone asked, here’s a subscription form where you can get an update every time we post a new in-depth article like the one you just read.