Our team here at Whaling City Solar aren’t just sitting at our desks all day, we’re out in the field talking with homeowners like you! We’ve heard every sort of question about solar asked in every sort of way. We’re going to take some of those questions and answer them right here for everyone to read themselves. Some may overlap, some may be out in left field, but they are all real questions we’ve been asked. As verbatim as we can remember them.
Today’s question: “Thanks for the proposal. All the numbers makes sense, but I don’t have $20,000 to spend on solar right now. How come everyone I know that got solar panels didn’t pay anything upfront?”
This is probably the most common question we get in one form or another. I think we can touch 3 major topics to round out an answer:
- Escalating Electricity rates
- Owning vs. Leasing solar
- Total cost of ownership
Escalating Electricity Rates
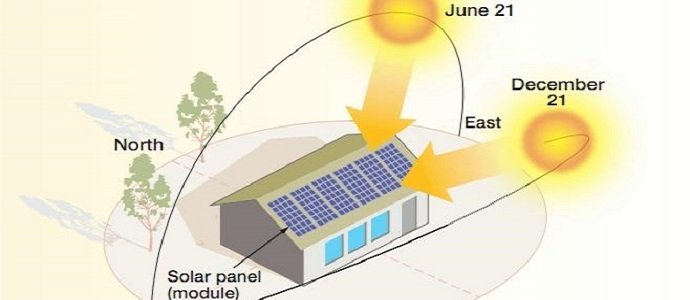
An unusually high electric bill is typically what prompts the first interest in exploring solar so let’s start there. Here’s an example of a fairly normal electric bill of $150 per month average, or $1,800 per year. From the homeowners perspective, they likely have $75-$100/mo bills in the winter and $200-$225/mo in the summer when the A/C is running. What will this house spend on electricity over the next 25 years?
That all depends on what the electric company will charge right? If the utility feels generous and decides to never raise rates again, it’s easy to calculate: $1800 x 25 = $45,000.
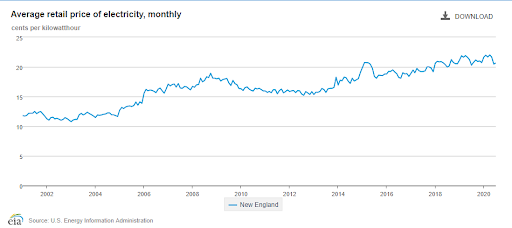
Looking back over the last 60 years, we can conclude that the likelihood of that happening is pretty much zero. Rates increase each year for a multitude of reasons, if you’re interested you can read about more here. For the rest of us, we can assume an increase of anywhere from 2% to 5% every year like clockwork. And while the difference between 2% and 5% might seem small, even that very small range can have big consequences over time!
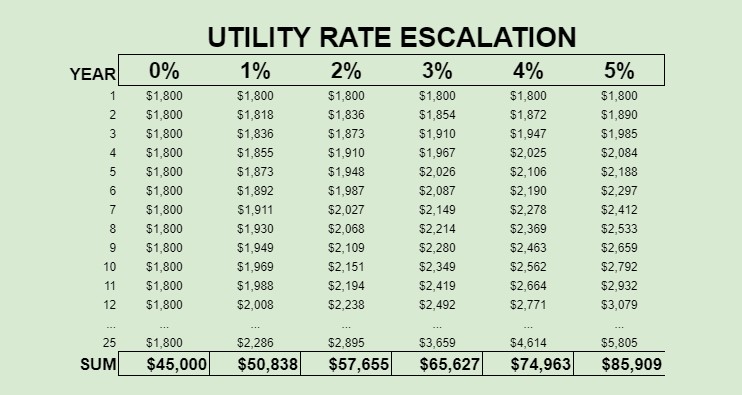
Here we’ve created a simple spreadsheet to show how the average variance of utility rates affect the overall electricity spend over time. A 4% increase to our $1,800 example billing year would add $72 to the total spend in 2022. That’s $6 a month. How many homeowners noticed that their Feb 2021 bill is $6 more than last Feb 2020?
For the purposes of this article I’m going to take a nice conservative number between 2% and 3%. Let’s say $60,000 is a safe guess to what our example home will spend over the next 25 years. Surprised at the size of that number? Most are.
Owning vs. Leasing Solar
If you’ve read our blog before you’ve probably read the following sentence:
Solar arrays are nothing more than a set of equipment that creates kWh for your home or business.
We’re big on this point because it helps homeowners make sense of the cost of going solar. Like all other projects, the cost of a solar array is made up of parts and labor. Financing costs can, and should, be looked at separately the same way you would look at your car loan or home mortgage.
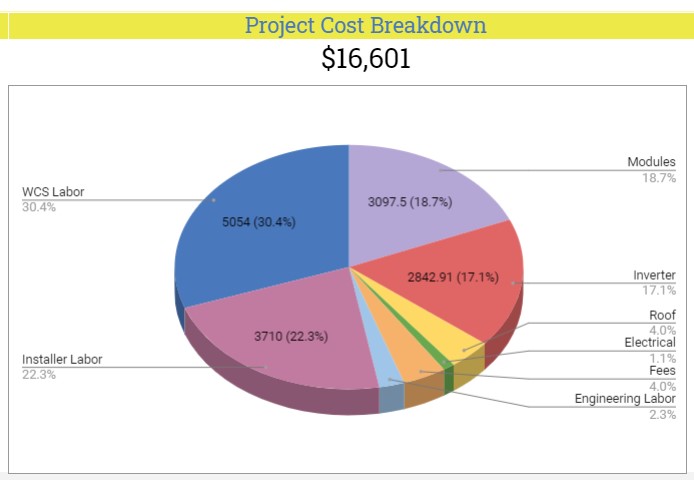
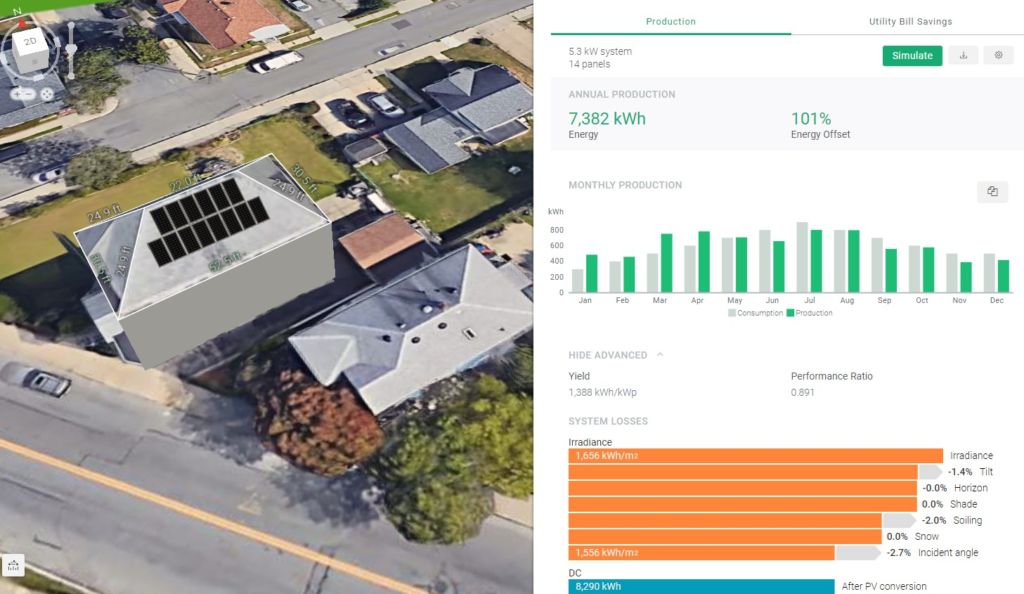
A south facing solar array that creates 7,400 kWhs annually would offset our example home’s bill by 100% and would be warrantied for 25 years. Above is how much that project would cost to install from soup to nuts. Broken down it’s about $7000 in equipment and $9,000 in labor including admin. So given the example at hand, we’re comparing $16,601 total installation spend to our $60,000 electricity spend estimate. Pretty amazing that a $16,000 solar install will offset so much future electricity use. Going further, would you believe additional federal and state incentives will reimburse over $10,000 towards that $16,601? It’s true.
This massive difference in array costs vs. rising electric rates is the bedrock of the entire solar industry in 2021. The difference is so large, and so poorly understood by the public, many solar companies simply see a chance to increase pricing as much as they can. When comparing to the alternative of $60,000, if the first contractor you speak with shows you the same system for $26,100 (vs. the $16,100 it really costs) you’d likely still be inclined to move forward while they pocketed an extra $10k margin.
Could this be prevented? It’s difficult because it demands education and effort on the part of the homeowner. After all, who would know what solar panels should really cost unless they were in our industry? $26,000 sounds as believable as $16,000, and it’s a still good deal. This extra room in the contract is where many finance companies insert hidden fees and make the majority of their profits in exchange for instant approval.
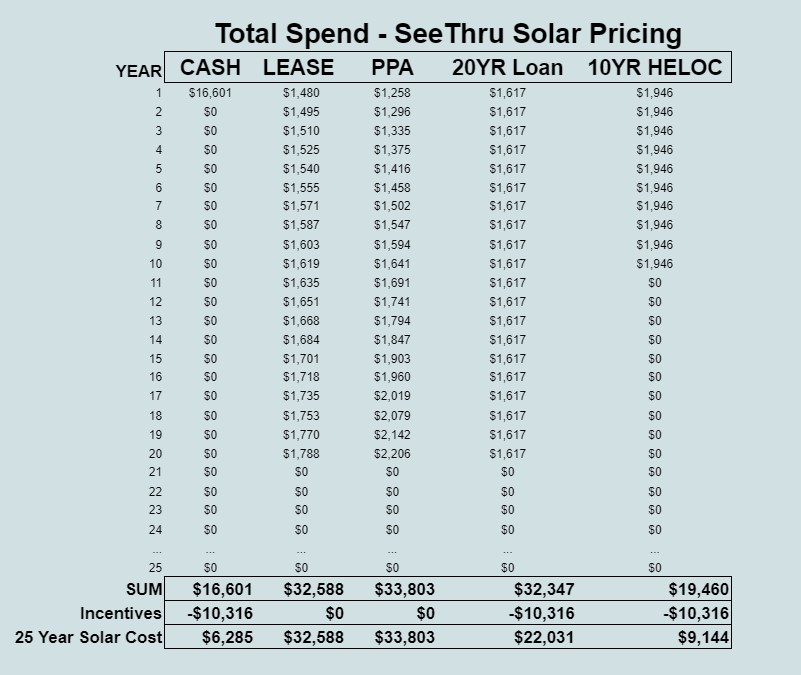
This very much appreciated chart above shows four common solar financing tools that solar installers are using today to sell solar arrays. If you’ve gotten a solar proposal before, chances are you’ve seen one of them pitched to you (although likely not the last column!).
What do all 5 columns have in common? They all are significantly less than $60,000, again showing that solar is a good deal no matter how you slice it up.
What do the middle 3 have in common? Yes they continue for 20 years, but the year 1 cost is less than $1,800. Meaning the homeowner starts saving money right away and doesn’t have to wait to see the savings over time. This is a very effective proposition and easy to understand. $150 a month Eversource bill vs. $110 a month Sunrun lease? Many pick the latter, and worry about next year when next year comes.
Total Cost of Ownership
I want to share one more chart before we end because it was one obvious detail and one not so obvious. The chart below has the same 5 columns, calculated in the same manner, but we’ve priced the project at the MA state average of all the systems of that exact size were sold for in 2020. To save you the math, it’s about 25% higher then the Whaling City Solar See Thru Pricing in the previous green chart.
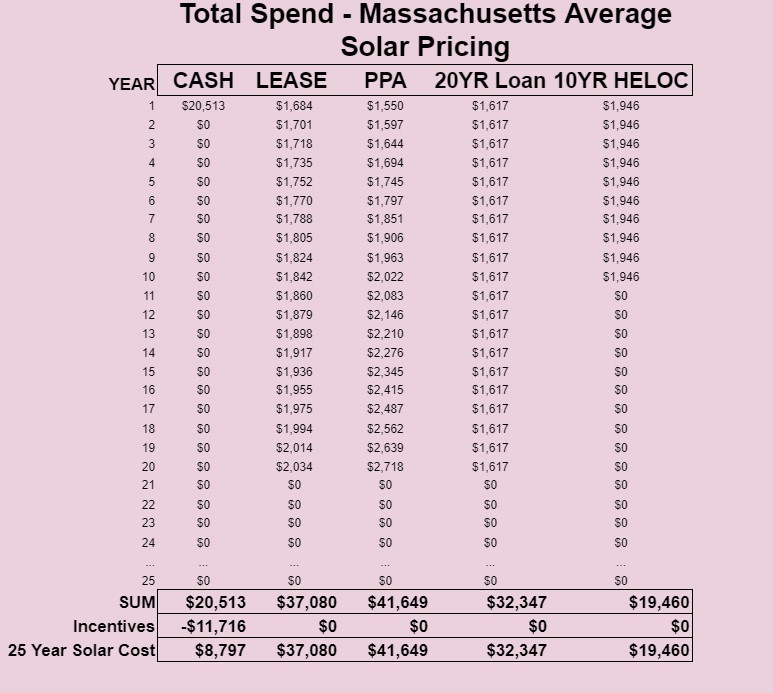
What do we see here? All the columns are still significantly less than $60,000! The middle 3 columns are also still less than $1,800 per year, meaning it’s zero down and saving money on month 1. That’s why they sell and install the same equipment at a premium markup. The reality is many homeowners don’t do their research, don’t get multiple quotes, and sign the first good deal they see.
Can you notice something else that changed in the above graph? The incentives disappeared from columns 4 and 5. This mirrors how the majority of solar loans are sold in our state. The solar company shows a payment schedule that’s less than the $1800 year 1 cost, but it’s contingent upon paying the 26% tax incentive total back to the loan principal.
Compare the 4th column of the green and pink charts. At the risk of being a broken record – $32,347 vs. $60,000 is still a good deal. However a certain solar company based in New Bedford could install the exact same equipment at a respectful margin and give let that homeowner keep their extra $10,000 towards other home improvements.
Finding our content interesting? We’re realizing there are more of you out there than we thought! So because someone asked, here’s a subscription form where you can get an update every time we post a new in-depth article like the one you just read.